The post Is This A Crucial Time To Stack Artificial Intelligence (AI) Tokens As They Stumble Again? appeared first on Coinpedia Fintech News
The Artificial Intelligence (AI) category has continued to trade under a robust bearish influence for the past week amid a significant correction in the cross-border financial system.
Moreover, top tokens from this category have recorded notable corrections over the past seven days, highlighting a strong negative outlook for these tokens in the coming time.
With the current market situation, investors are concerned about their investments in their AI tokens and considering if this is a crucial time to stack up more tokens for the upcoming bull rally?
Injective (INJ):
The Injective price displayed a neutral trend for the first two months, indicating a weak price action for the altcoin in the crypto space. However, as the volatility in the market grew, the INJ price jumped 64.58% in valuation.
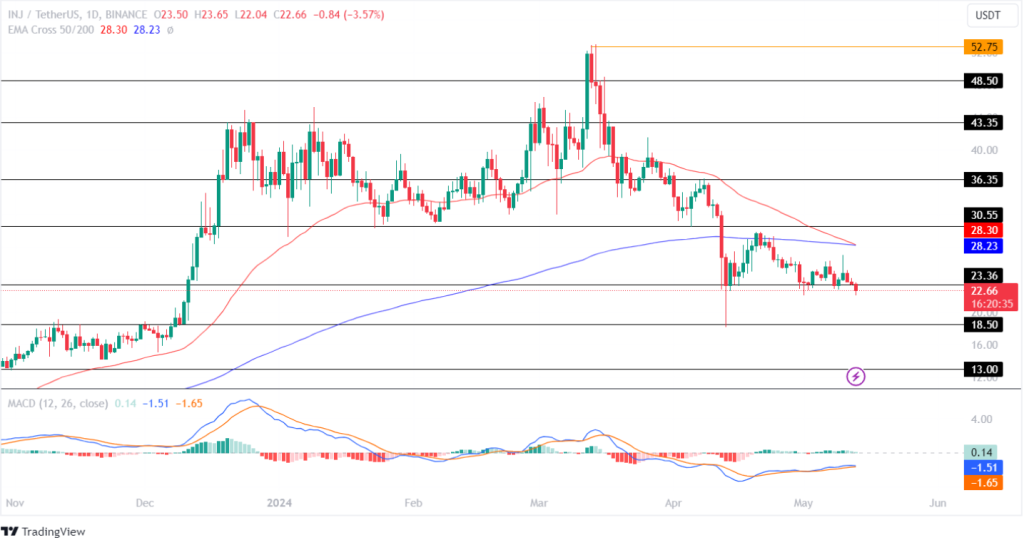
Following this, the bulls lost momentum, resulting in the price recording a correction of 55.71%. Since then, the price has been trading sideways between $23.36 and $30.55. Furthermore, the Cross EMA 50/200-day shows a Death Cross, indicating a high possibility of a bearish price action.
The technical indicator, MACD, displays a constant flatline in the histogram, indicating a weak price action for the altcoin. Moreover, the averages show a neutral trend, highlighting uncertainty in future price action.
If the market holds the price above the support level of $23.36, the bulls will regain momentum and prepare to test its resistance level of $30.55. However, if the bears fail to hold the price at that level, the Injective price will fall to test its support level of $18.50 this month.
Render (RNDR):
The RNDR price recorded a significant price action this year by successfully achieving a new all-time high of $13.840 after recording a surge of 208.92% in its portfolio. Following this, bulls lost momentum, resulting in the price losing approximately 49% within the next one month.
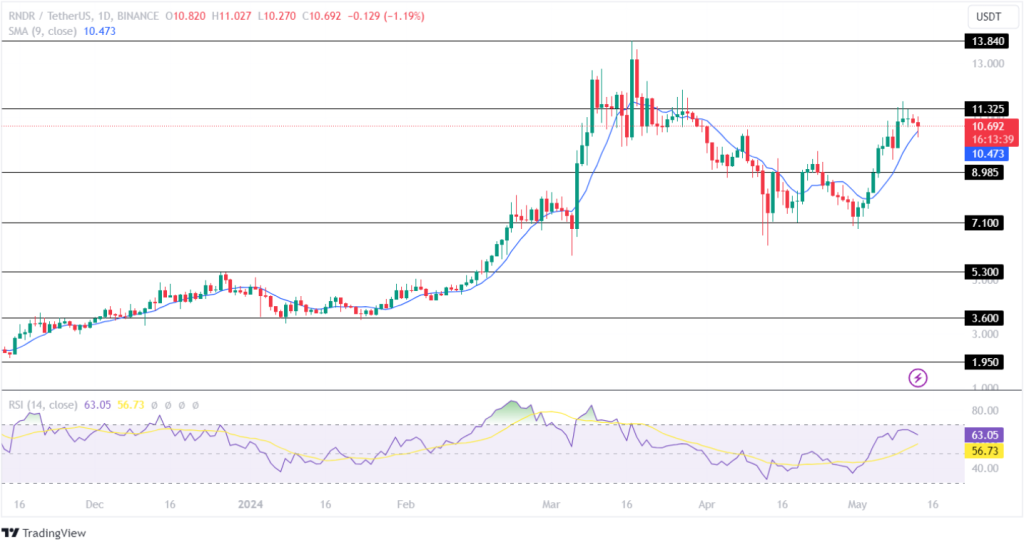
After hovering close to its crucial support level at $7.10 for a period, the bulls regained momentum and have jumped 59.85% within the past two weeks. Moreover, the SMA acts as a support to the Render price chart, indicating a possibility of a bullish rebound in the coming time.
The Relative Strength Index (RSI) shows a bearish curve below the over-bought range, suggesting an increased bearish price action in the crypto industry. However, the average displays a bullish rise, indicating uncertainty in the crypto space.
If the bulls regain momentum, the Render token will prepare to test its upper resistance level of $13.840 during the upcoming weeks. Conversely, if the bears continue to gain power, the RNDR price will plunge toward its support level of $8.985.
Akash Network (AKT):
The AKT price has recorded a correction of approximately 3% within the past day and 8.59% over the past seven days, indicating a strong bearish reversal in its price action. Moreover, the Simple Moving Average (SMA) shows a high possibility of a bearish convergence, indicating uncertainty in future price action.
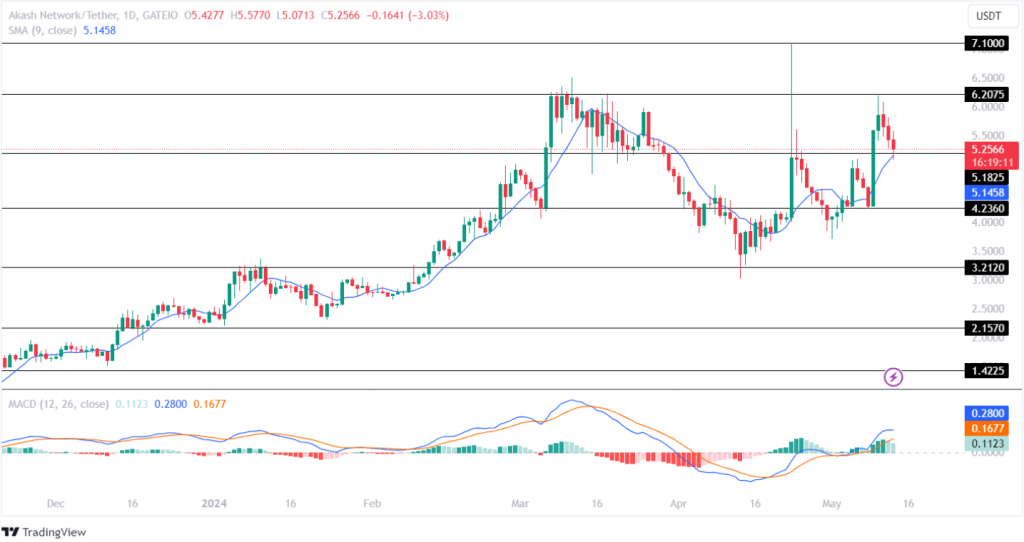
The Moving Average Convergence Divergence (MACD) displays a constant decline in the chart, highlighting increased selling-over-buying pressure in the crypto industry. Furthermore, the averages show a negative price action, suggesting a bearish outlook for the AKT price this week.
If the market holds the price above the support level of $5.182, the bulls will regain momentum and prepare to test its resistance level of $6.20 soon. Negatively, if the bears continue to dominate the market, it will fall toward its lower support level of $4.23.
Theta Network (THETA):
After recording a massive surge of approximately 270% this year, the THETA price lost momentum following recording a high of $3.469. This resulted in the altcoin losing 27.78% in valuation. Following this, the price traded in a closed range between $2.505 and $3.050 for a brief period.
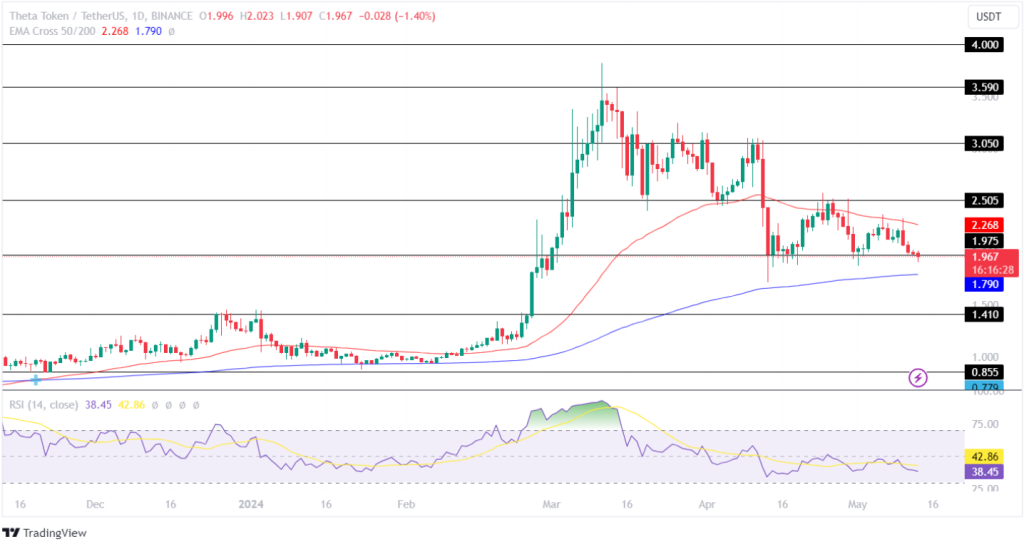
As the volatility grew, the bulls faced rejection at the resistance level of $3.050 and plunged 35.24% within the next two days. Since then, the price has been displaying a neutral trend and is on the verge of testing its crucial level at $1.975, the outcome of which is unpredictable.
The technical indicator, RSI, constantly traded below the mid-point since April, highlighting a weak price action for the THETA token within the crypto space. Moreover, the average shows a constant decline, suggesting the price will continue losing value.
If the bulls regain momentum, the Theta Network price will prepare to test its resistance level of $2.505 this week. Conversely, if the bears hold power over the bulls, the THETA price will break down its crucial support level and plunge to test its lower support level of $1.410 in the coming time.
Conclusion:
The volatility in the crypto industry is on a constant rise, highlighting increased buying and selling pressure in the crypto space. Moreover, the AI category continues struggling to hold its price above its important support levels, indicating uncertainty in future price action.
Also Check Out: Top 5 Altcoins To Stack For The Upcoming Week!

