

The post Litecoin Price Analysis: Bearish Waves Indicating A Price Plunge For LTC Price? appeared first on Coinpedia Fintech News
Despite the industry experiencing a strong bullish sentiment in the market, with top coins recording new yearly highs, Litecoin has displayed neutral trends as the coin has gained less than 5% within the past week and has cumulatively added approximately 15% within the past month.
The Litecoin price experienced a massive price plunge during August, after which the price was seen trading sideways between $63.37 and $66.44. The market experienced a short bounce, resulting in the price breaking out of the resistance level, but the rally was short-lived as the bears pulled back the price.
The bulls struggled to hold the price above the support level of $63.37, but the market was seen trading under a strong bearish influence, resulting in a breakdown.
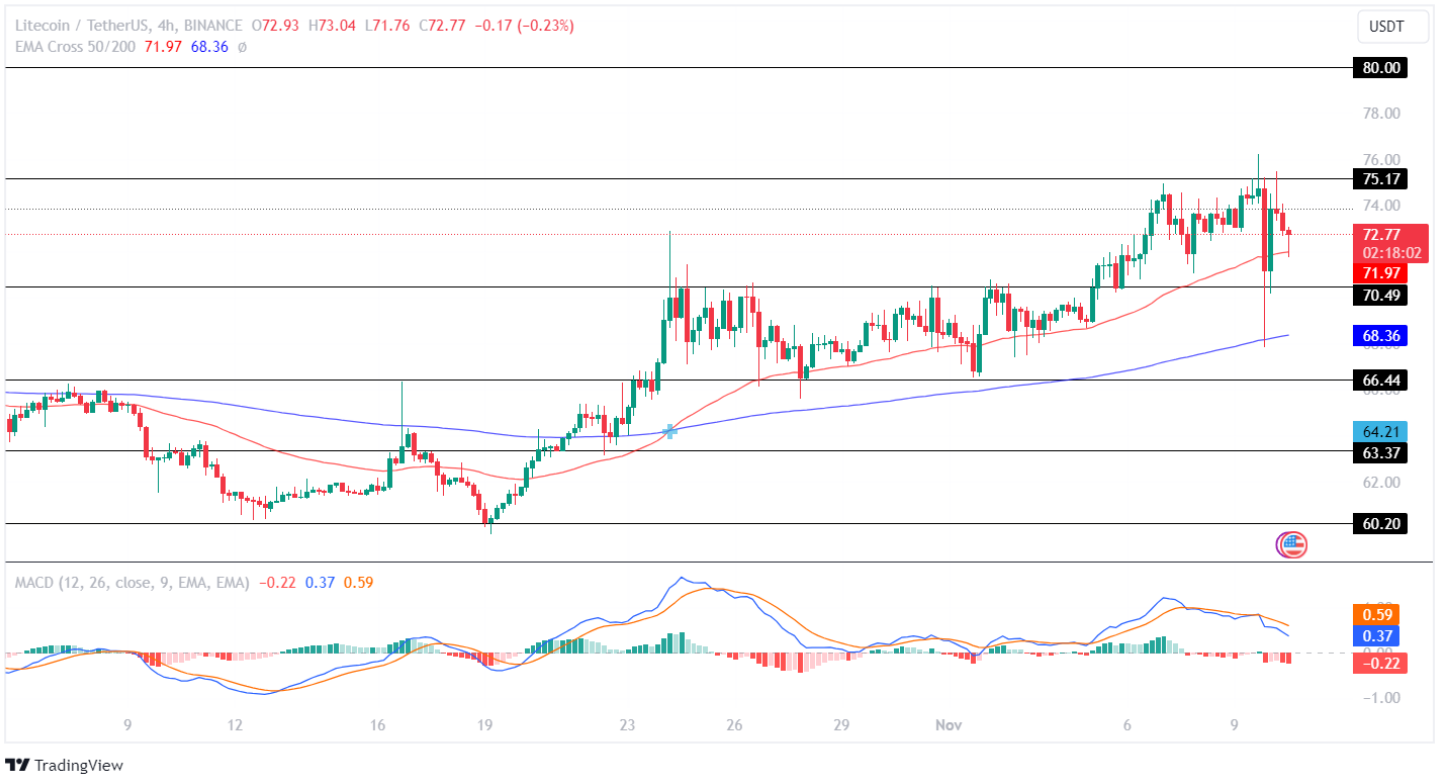
After this, the bulls managed to reclaim the resistance level, following which the price traded sideways for over a month with minor fluctuations. A decline in price action led the coin to lose momentum and again fall below its support level.
The LTC price traded in a closed space between $60.20 and $63.37, after which the price gained bullish sentiment and broke out but was later rejected at the resistance level of $70.49.
The price was seen trading in a consolidated range for over two weeks, following which the price regained momentum and broke out. Litecoin was rejected at the resistance level of $75.17 and has traded sideways since.
Will LTC Rise Back Up?
The MACD displays a constant red histogram, indicating a bearish influence in the market. Further, the averages show a decline in the chart, suggesting the price will continue to lose value before attempting a bounce back.
If the bulls gain power and push the price above the key resistance level of $75.17, the price will regain momentum and prepare to test its upper resistance level of $80.00 soon.
Further, if the market holds the price at that level, the price will make a run to test its resistance level of $84.86 this month.
On the flip side, if the bears overpowered the bulls, the price will lose momentum and fall to test its support level of $70.49 soon. Moreover, if the bears continue dominating the market, the coin will experience a price plunge and drop toward its lower support level of $66.44 in the coming time.