


The post Polkadot Price Analysis: Struggling To Stay Afloat $5, DOT Price Haunts A 15% Drop! appeared first on Coinpedia Fintech News
Maintaining a declining trend in the daily chart, DOT Coin price forms a descending triangle pattern. After struggling to exceed the $7.55 resistance level, DOT prices currently trade at a 33% discount from the previous swing high.
Moreover, the price action forms a consolidation phase between $5 and $5.53 Over the past month and traps the trend momentum. Currently, the DOT coin price displays low price rejection with a 0.59% fall in the daily candle.
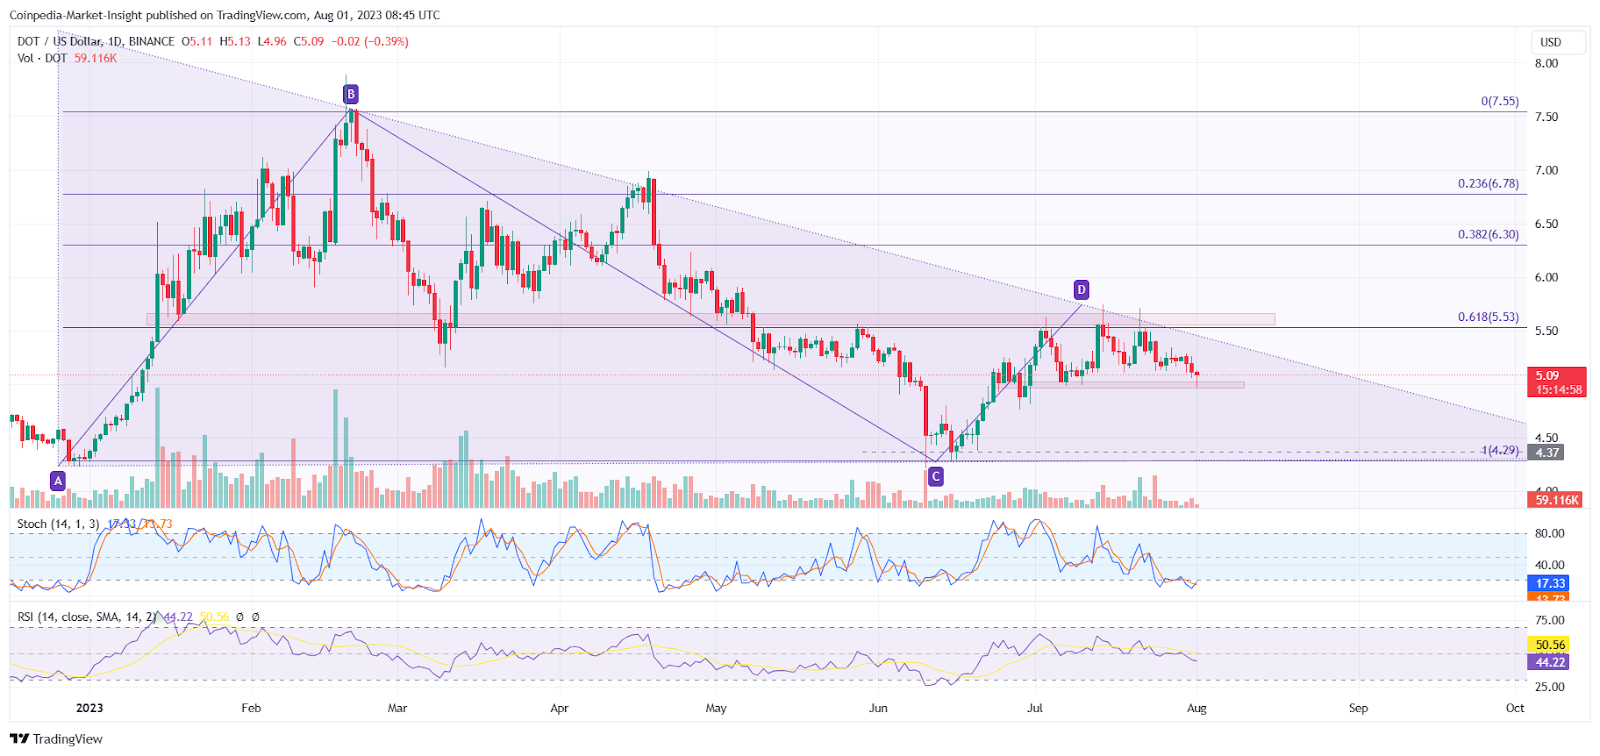
With lower price rejection, DOT prices project a bullish struggle to sustain above the $5 mark. If the Polkadot coin price manages to float above $5, a bullish cycle might rechallenge the $5.53 resistance level. The $5.53 coincides with the 61.80% Fibonacci level making it a strong horizontal level.
However, on the opposite end, closing below the $4.90 can lead DOT prices to a 15% off to $4.30 support level.
Regarding the technical indicators, the stochastic indicator displays a double bottom formation in the oversold territory, projecting a potential recovery in motion.
However, the RSI indicator is declining from the halfway line toward the oversold territory.
Therefore, the technical indicators display a strong bearish influence over the DOT price trend.
In a nutshell, the DOT price can reach $4.30 with a range fallout and a closing below $5. Optimistically, the 15% drop to $4.30 will provide a buying opportunity for long-term Polkadot investors.