


The post Memecoins Mania Hype Fading Away! Will The Category End This Year On A Bearish Note? appeared first on Coinpedia Fintech News
The crypto industry has experienced significant price fluctuations during the past week, indicating a massive ongoing price action in the crypto industry. Further, the memecoins hype seems to have reduced as the top tokens of this category have been constantly trading under a bearish influence for a while.
Dogecoin Price Analysis:
The Dogecoin price traded in a closed range between $0.07686 and $0.08234 for a brief period, following which the bulls lost momentum and the price plunged. The bulls held the price strong, resulting in a bounce back in the range.
Further, the DOGE price jumped over 30% before facing rejection at $0.10719. Since then, the price has been constantly trading under a bearish influence and is on the verge of testing its crucial support level at $0.08997, of which the outcome is unpredictable.
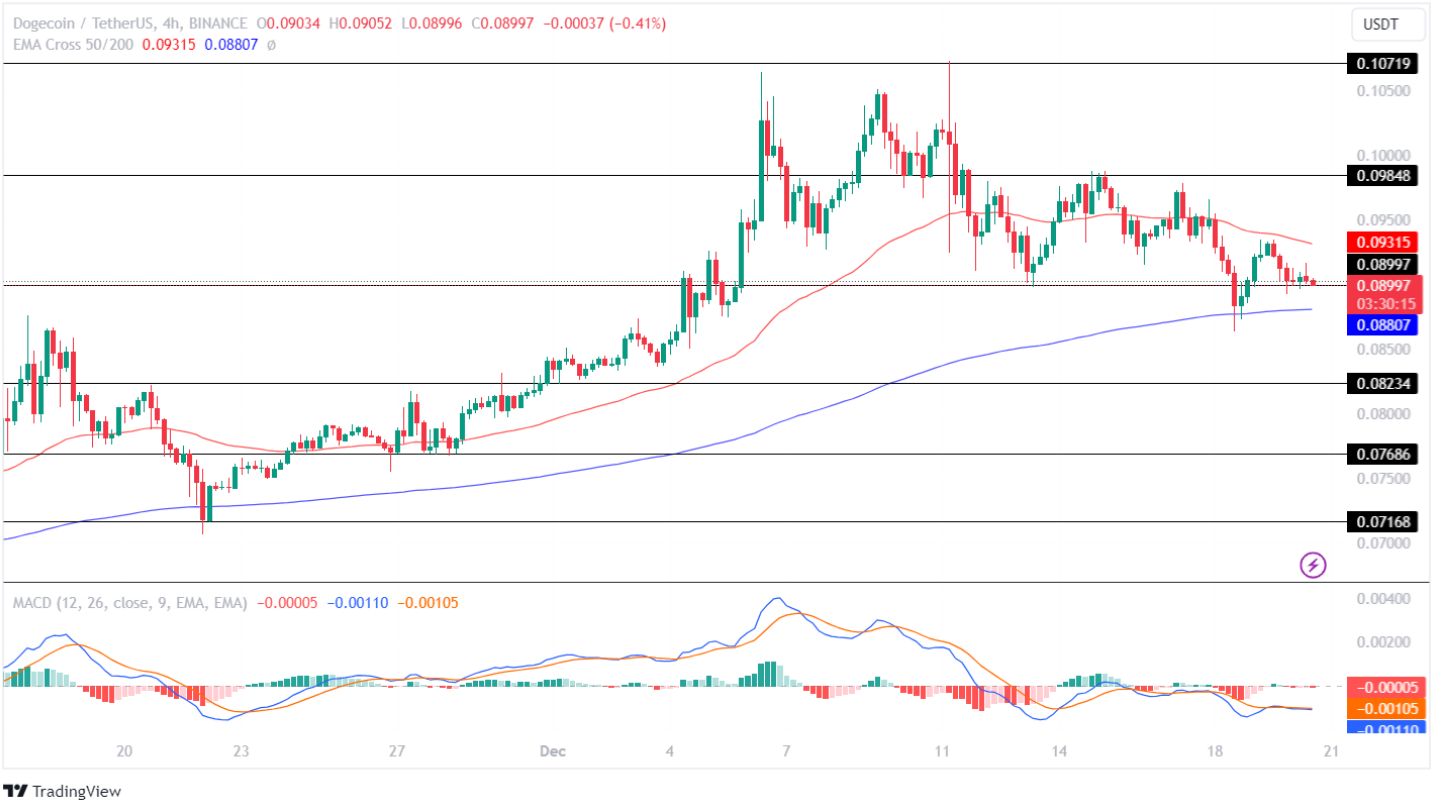
The technical indicator, MACD, displays a constant flatline for a while, indicating weak buying and selling pressure in the market. Further, the averages show a neutral trend, suggesting uncertainty in the future price action for this token.
If the bulls hold the price above the support level of $0.08997, the price will regain momentum and prepare to test its resistance level at $0.09848. Further, if the market continues to gain momentum, it will rise and test its upper resistance level of $0.10719 in the coming days.
Conversely, if the bears overpowered the bulls, the DOGE price will lose momentum and prepare to test its lower support level at $0.08234 this month.
Shiba Inu Price Analysis:
The SHIB price followed in the footsteps of the category leader and traded sideways in a closed range between $0.00000800 and $0.00000860 for a brief period, following which the market gained momentum and the price recorded a jump.
The Shiba Inu price broke out of multiple resistance levels and jumped approximately 25% in value before facing rejection at $0.00001074. Since then, the memecoin has traded sideways between $0.00000926 and $0.00001074.
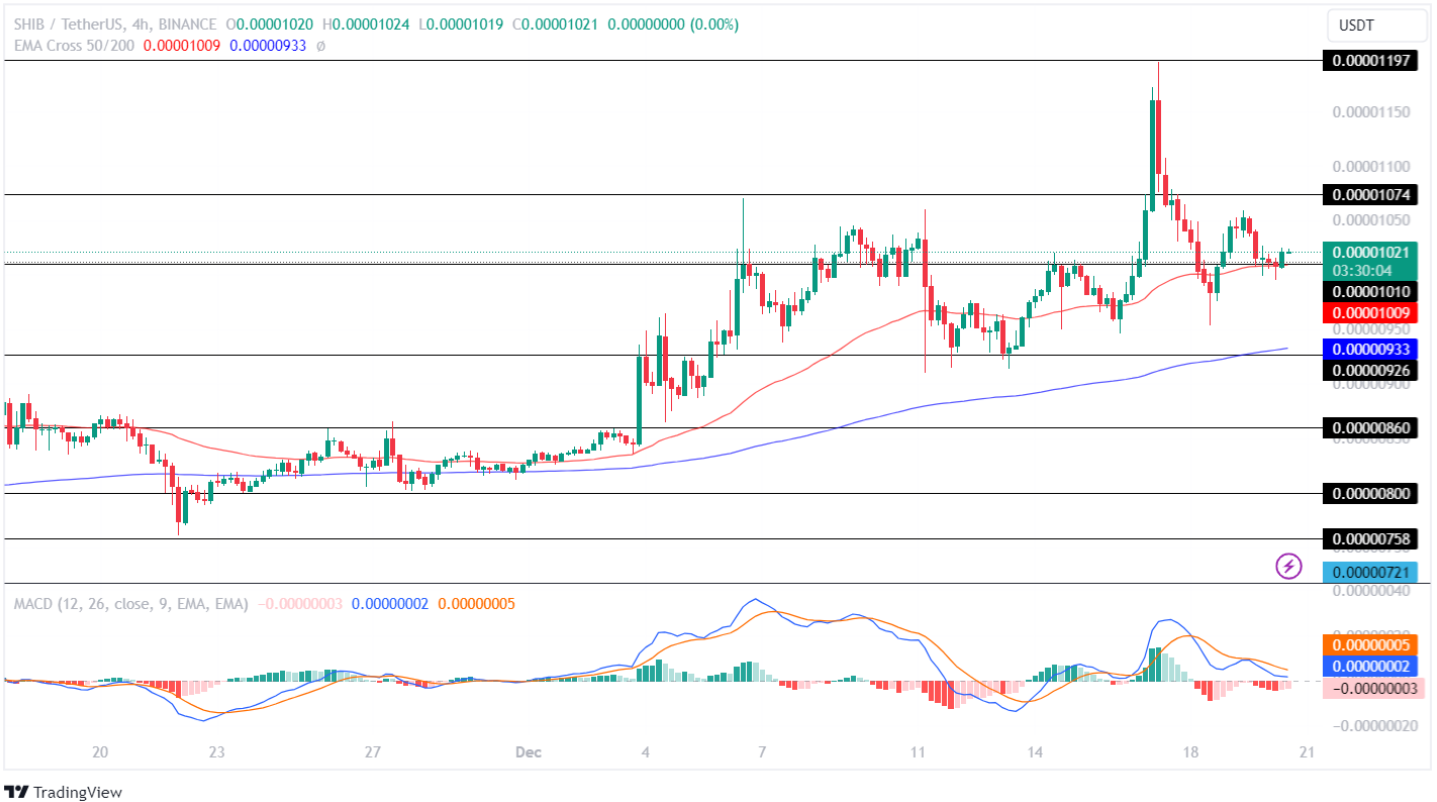
The Moving Average Convergence Divergence (MACD) displays a constant red histogram, indicating a higher selling-over-buying pressure in the market. Moreover, the averages show a decline, suggesting the price will continue losing momentum in the coming time.
If the bulls hold the price above the support level of $0.00001010, the SHIB price will regain momentum and prepare to test its resistance level of $0.00001074 in the coming days.
On the flip side, if the bears overpowered the bulls, the price would lose momentum and fall to test its support level of $0.000009226. Moreover, if the bears continue to dominate the market, it will plunge further and test its lower support level of $0.00000860 this month.
Bonk Price Analysis:
The BONK price traded in a narrow space between $0.000003458 and $0.000004945 for a brief period, after which the market gained momentum, and the bulls recorded a massive surge in its value.
The Bonk price jumped over 200% before facing rejection at $0.000015010. After trading sideways for a while, the price regained momentum and recorded another jump of 111%, after which it faced restriction at $0.000031786. Since then, the price has been trading under a bearish influence.
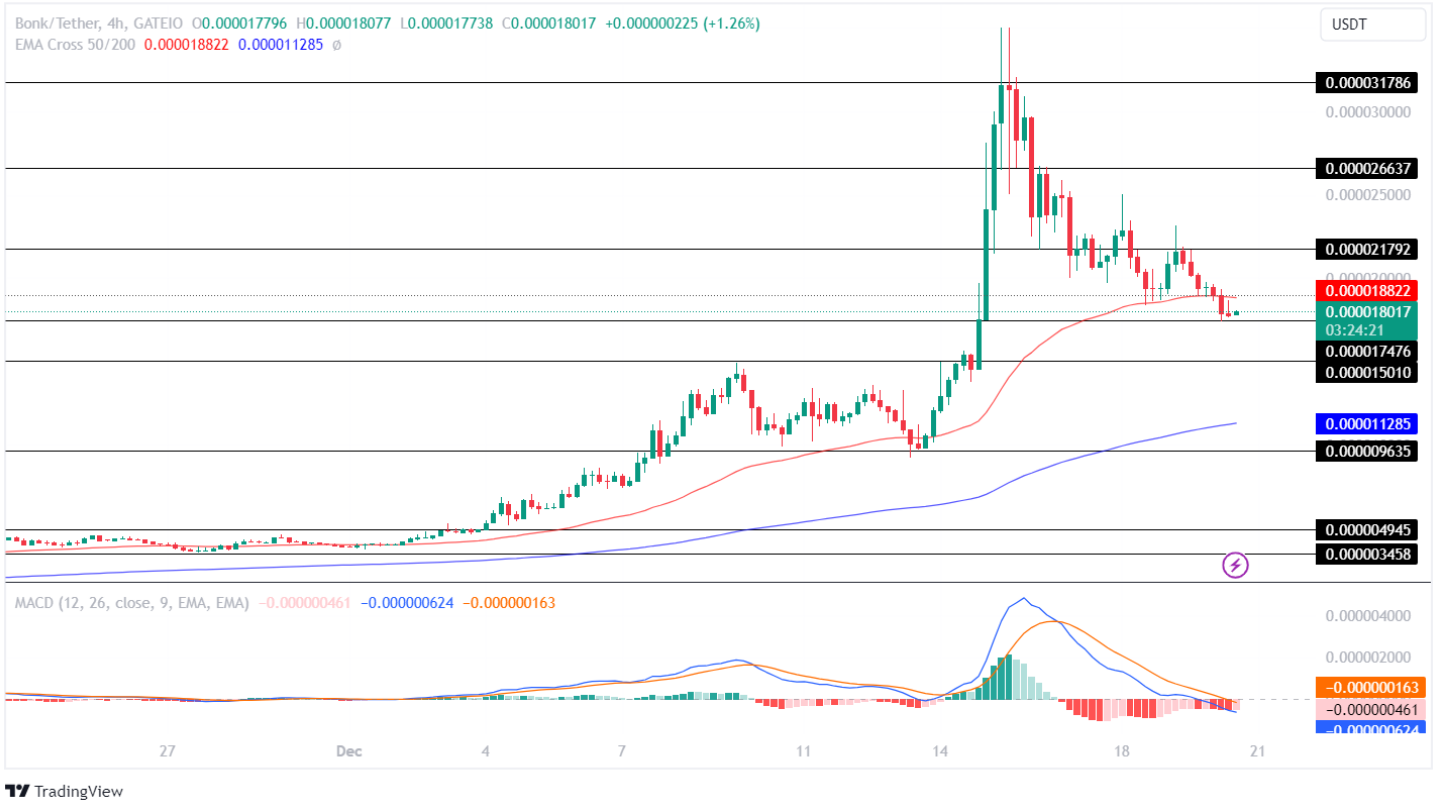
The MACD shows a constant red histogram in the chart, highlighting a strong bearish influence in the market. Further, the averages display a drop, suggesting the price will continue experiencing a correction in the coming days.
If the bulls hold the price above the important support level of $0.000017476, the price will regain momentum and prepare to test its resistance level of $0.00002179. Further, if the market holds the price at that level, it will rise and test its upper resistance level of $0.00002663.
Conversely, if the bears pull the price below the support level of $0.000017476, the price will lose momentum and fall to test its lower support level of $0.000015010.
PEPE Price Analysis:
The memecoin traded in a closed range between $0.00000105 and $0.00000114 for over two weeks, after which the PEPE price gained momentum and jumped 61% before facing rejection at $0.0000169.
Following this, the price traded sideways in a consolidated range between $0.00000150 and $0.00000169 for about a week. Since then, the price has been trading under a bearish influence and has recorded a correction of over 27% during the past week.
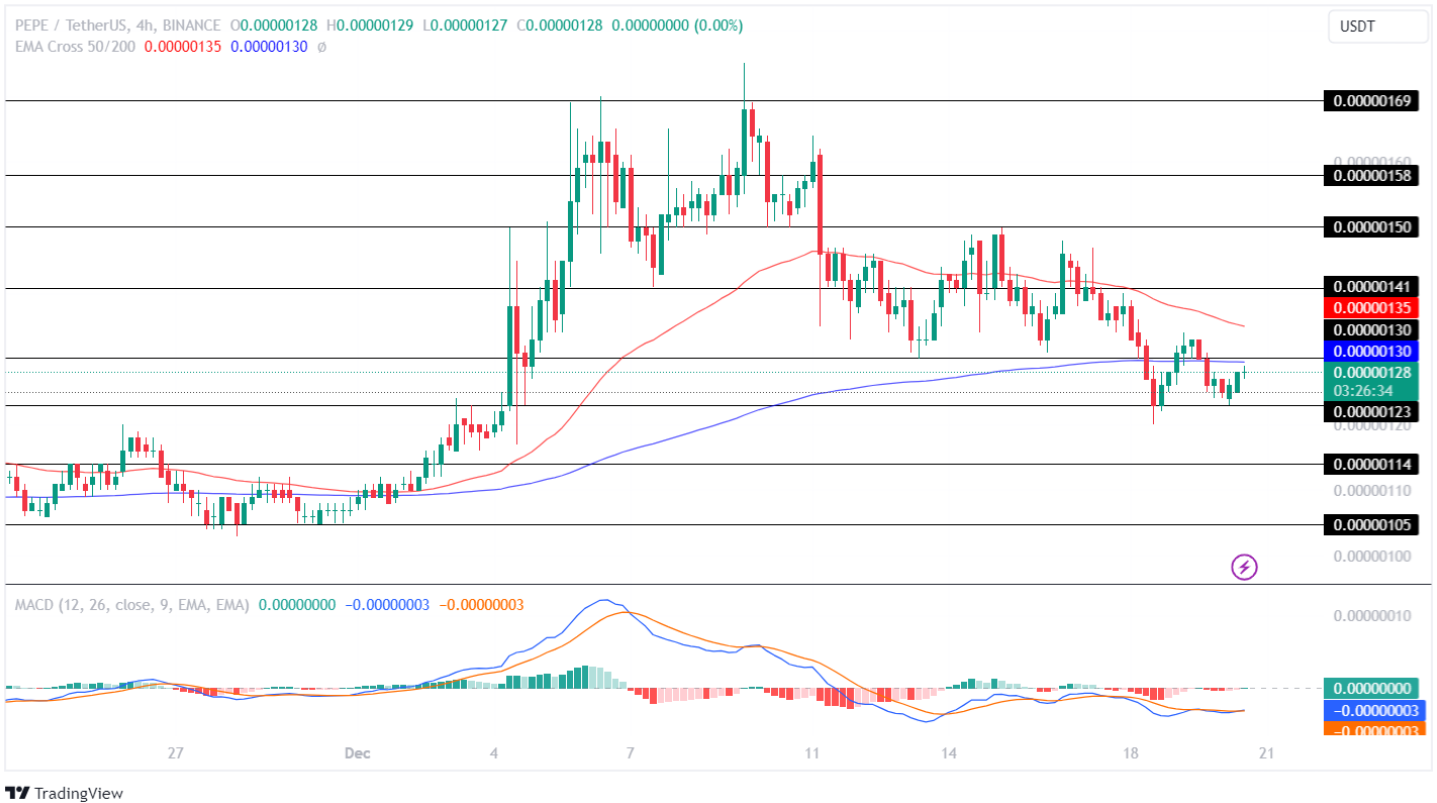
The technical indicator MACD continues to display a flatline in the chart, suggesting a decline in the buying and selling pressure for the coin in the market. Moreover, the averages show a neutral trend, highlighting an uncertainty in the future price action for this memecoin.
If the bulls push the price above the resistance level of $0.00000130, the price will regain momentum and prepare to test its resistance level of $0.00000141. Maintaining the price at that level will set the stage for Pepe coin to test its upper resistance level of $0.00000150.
Negatively, if a trend reversal occurs, the price will lose momentum and prepare to test its lower support level of $0.00000114 this week. Moreover, if the bears continue to dominate the market, it will plunge further and prepare to test its crucial support level of $0.00000105.