


The post Will Ethereum (ETH) Price Drop Below $1000 By The End Of 2022? Here Are The Expected Price Levels appeared first on Coinpedia Fintech News
The bloodbath of Ethereum seems not to stop even after the much-anticipated merge that took place on 15 October.
According to our analysis, Ethereum may bring more bearish woes to investors as it forms a ‘Falling Wedge’ pattern.
Ethereum To Trade Below $1,000 Soon!
Bitcoin’s closest rival, which secures the second position in terms of market capitalization, may extend its bearish trend as it forms a ‘Falling Wedge’ pattern in the price chart. In such a pattern, a trend line is drawn connecting all the upper and lower limits of a cryptocurrency. The final meeting point of them indicates further price momentum of that particular crypto.
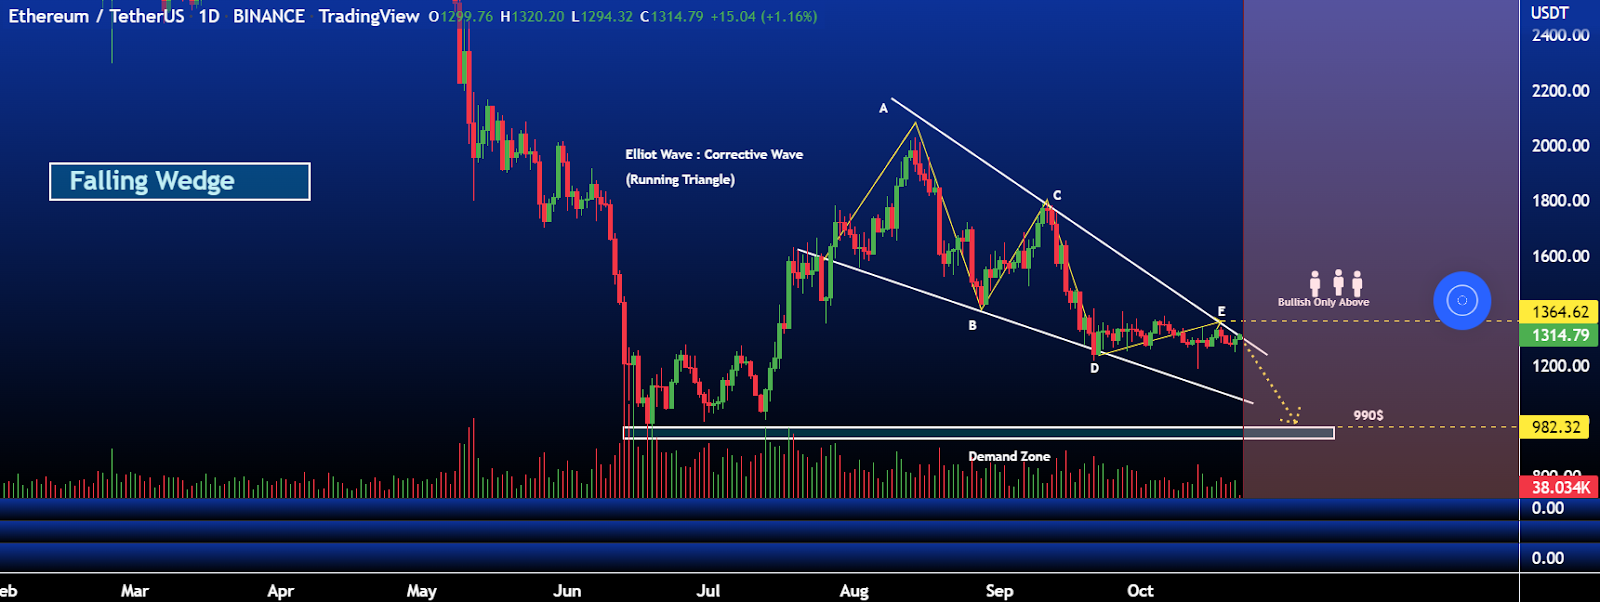
Looking at the daily price chart of Ethereum, the Wedge pattern meets at the downside, indicating a further bearish trend for ETH. To be more specific, the falling wedge pattern indicates a bullish or bearish reversal in the price.
Crypto analysts state that Ethereum’s current bearish trend is at a slow pace, hinting at a bearish reversal if ETH fails to make a breakout above $1,364 which can plunge ETH hard to the bottom line and trade below $990. However, a bull run is expected if it holds its price above $1,400.
Where Is ETH Price Heading Next?
According to CoinMarketCap, Ethereum is trading at $1,313 with an uptrend of 1.3%. The daily price chart of Ethereum does not look promising, as it hints at selling pressure. EMA-50 trades at $1,384, where the Bollinger band’s upper limit is placed. ETH may end up on a positive note if it holds its price between EMA-50 and EMA-100.
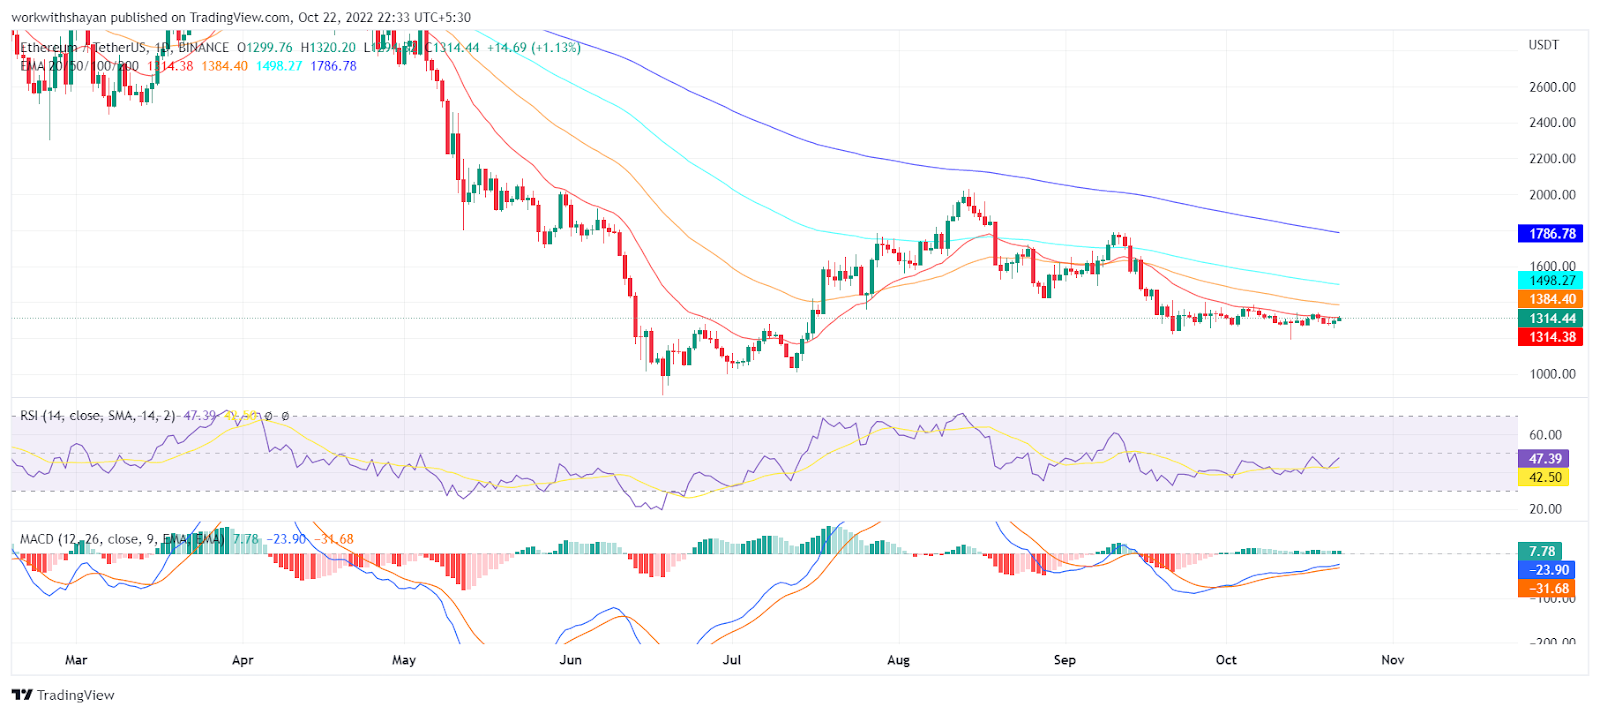
However, the positive momentum is not happening soon as ETH is building a bearish storm as the RSI-14 trades below the level of 50. However, we can expect Ethereum to make a slight retracement upward and touch $1,400 before initiating a bearish trend as the MACD line moves on the positive side.
The Bollinger Band’s lower limit is at $1,195, which is a crucial support level in the Ethereum price chart. If the support level breaks, Ethereum is expected to witness a sharp fall and take a support level at $998.
However, Ethereum may still have a chance to bring a ray of hope due to its Shanghai upgrade in 2023. Ethereum may soon invalidate its bearish analysis and initiate a bull run depending on the crypto market’s favorability and future developments.
If everything goes well, we can expect Ethereum to touch the $2,000 mark by the beginning of Q1 of 2023 and may soon break its previous all-time high of $4,878, which was achieved in November 2021.